

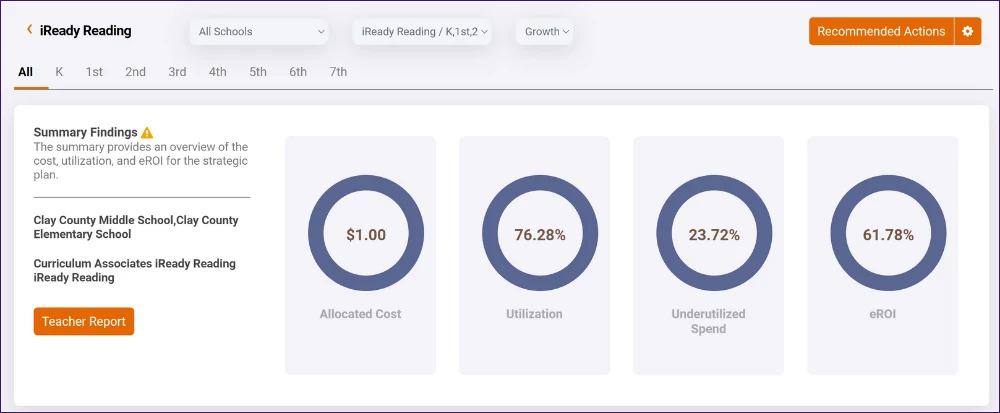
The eROI Resouces Report offers insights into program efficiency by comparing costs per student with performance outcomes to evaluate ROI.
It also tracks usage fidelity, showing how many students meet usage expectations, and highlights dollar utilization, identifying underutilized funds to optimize resource allocation.
Who Uses This report?
- School Administrators: Monitor instructional expenditures and ensure that resources are effectively utilized to drive student outcomes.
- District Administrators: Compare resource usage across schools to identify areas where instructional expenditures are underutilized.
- Curriculum Coordinators: Evaluate the link between instructional resource utilization and student performance, making necessary adjustments to resource allocation.
- Teachers: Understand how resource usage within the classroom aligns with expected performance outcomes.
- Data Analysts: Analyze expenditure vs. performance data to inform district-level resource planning and policy decisions.
Key Questions Answered
Are student grades reflective of their mastery of the benchmark assessments?
- The report correlates course grades with benchmark assessments to detect discrepancies like grade inflation or deflation.
How do different subgroups perform on assessments relative to their grades?
- Filter by subgroup to identify performance gaps within student groups.
Which teachers or campuses show significant alignment or misalignment?
- Break down data by teacher or campus to see alignment between course grades and benchmark assessments.
Which grade levels show the strongest or weakest alignment?
- Identify the grade levels where student performance in course grades is most or least aligned with benchmarks.
How to Access the eROI Resource Report
- Log in to the ROI Dashboard: Ensure you have the necessary credentials to access the platform.
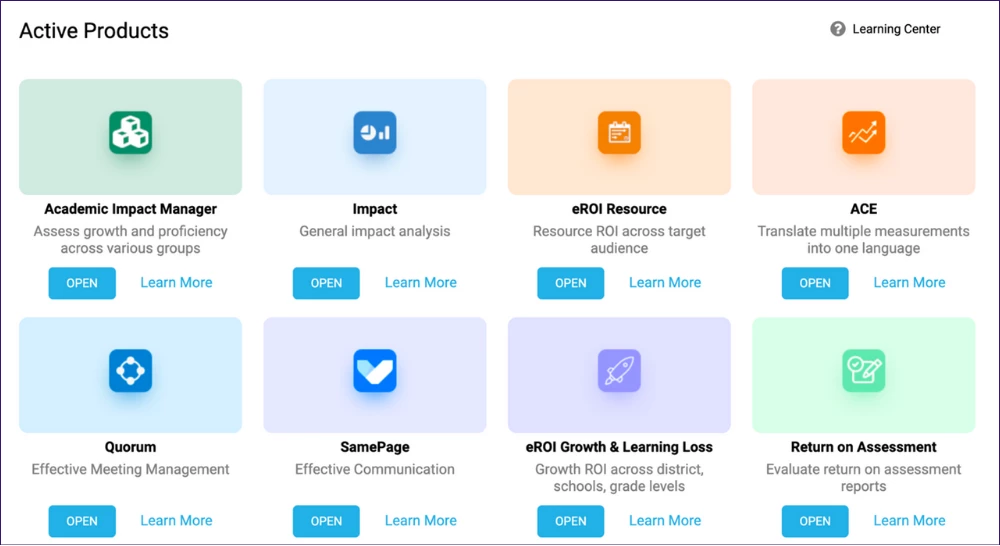
- Select eROI Resource Report: Locate and select the report from the available menu options.
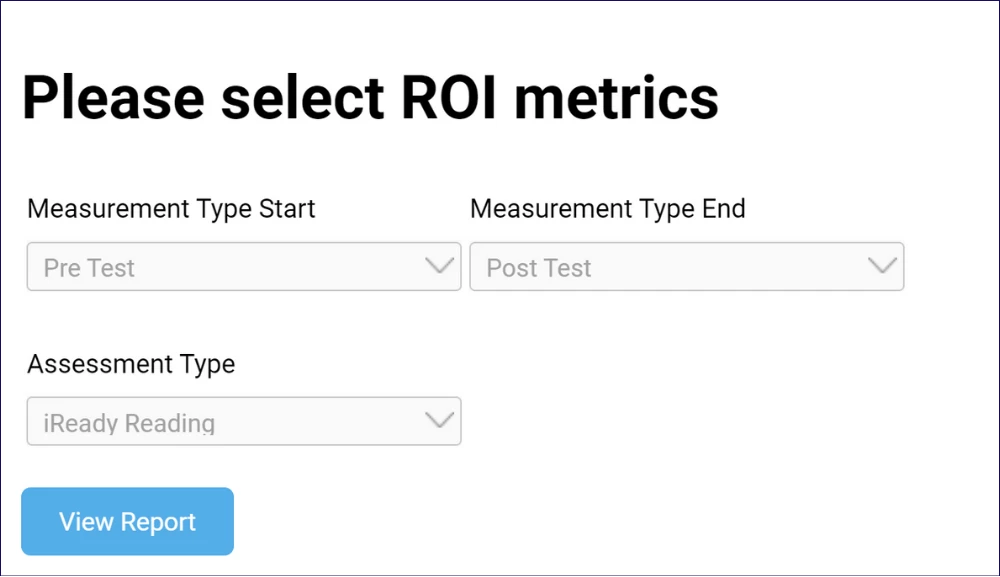
- Input Data Criteria:
- Select Time Range: Choose the time frame between assessment types.
- Select Benchmark Assessment: Select the benchmark assessment to compare with state performance data.
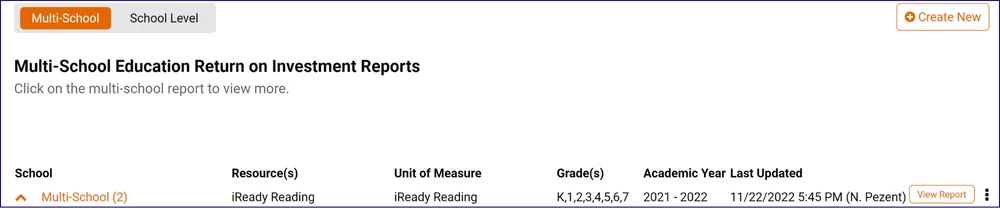
- View Report by School, Grade Level, or Teacher: Customize the report to display data based on school, grade, or teacher for more granular insights.
- Run the Report: Generate the report to track instructional expenditures and performance measures.
Understanding the Report Visuals
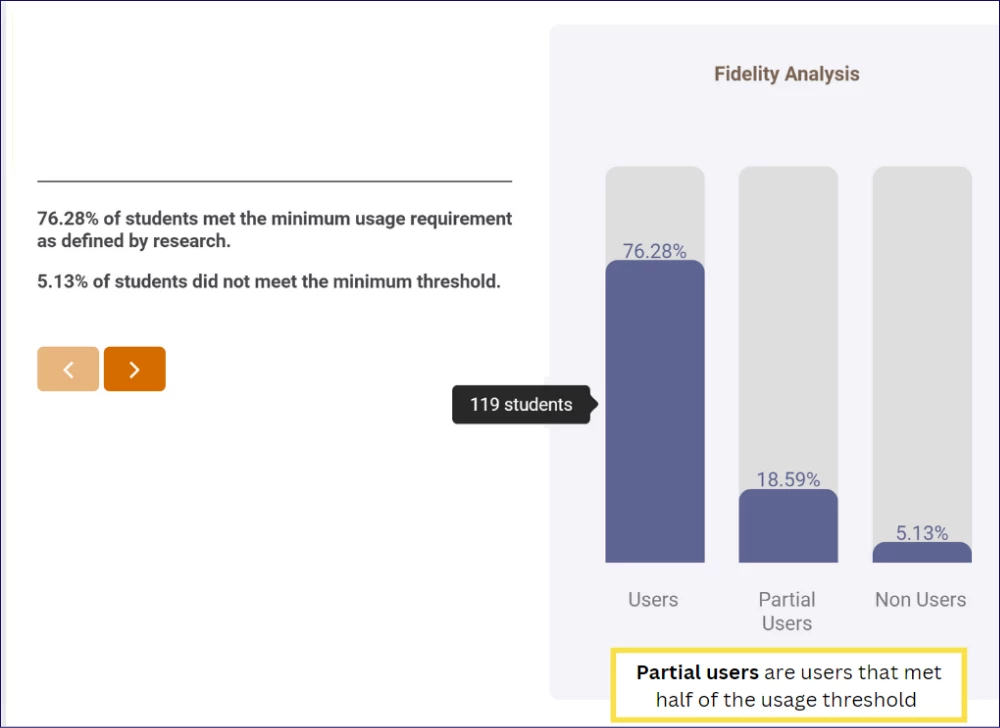
Fidelity Analysis: This chart shows the percentage of students who met the minimum effective usage threshold. This helps you determine whether or not you are utilizing your resources in accordance with research-based best practices.
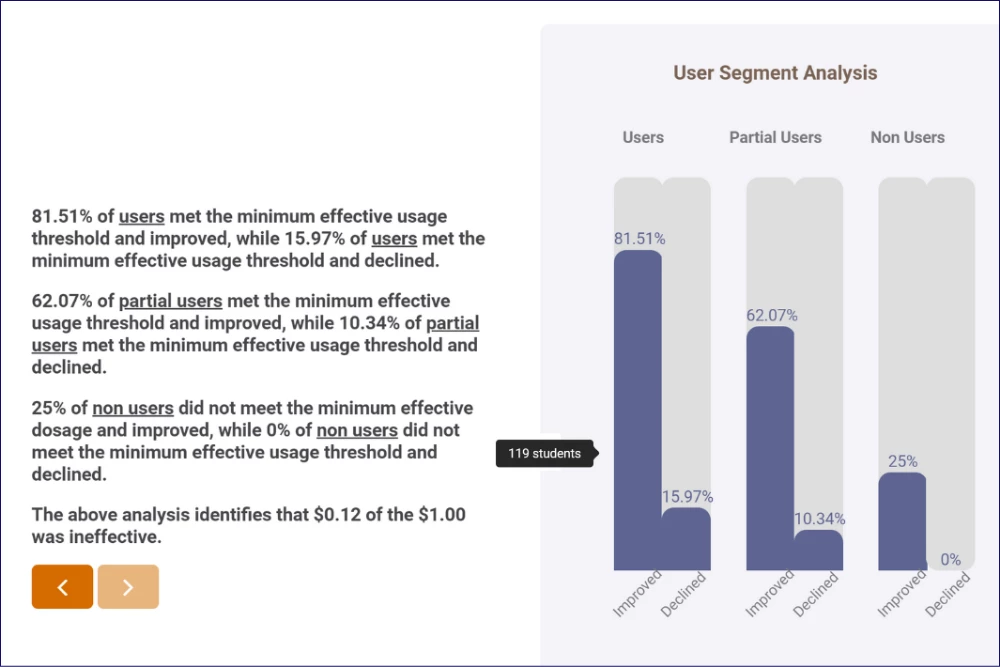
User Segment Analysis: This chart shows the percentage of students who met the minimum effective usage threshold and improved. This helps you determine how broadly the program impacted your students.
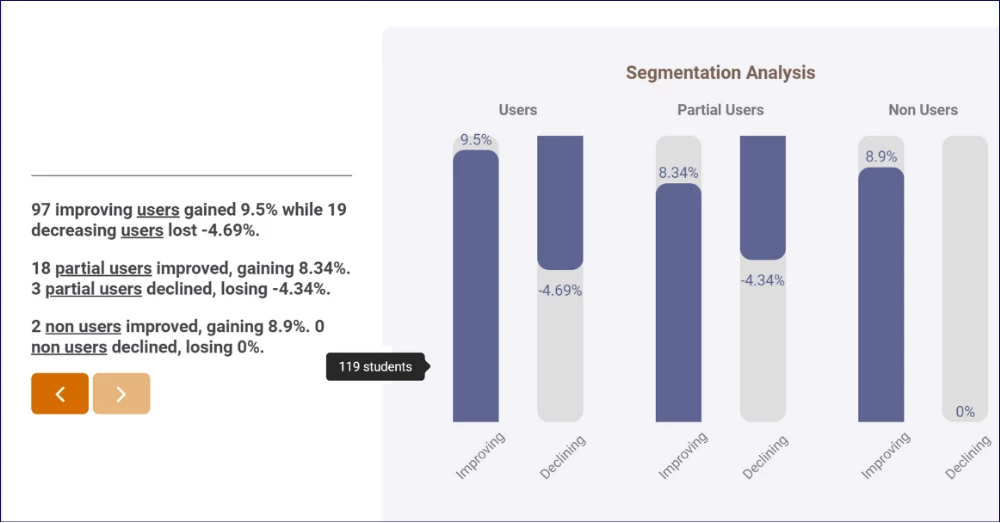
Segmentation Analysis: This chart breaks down users and non-users to show you the % increase or decline in each segment. It is useful to determine whether or not there is a material added benefit from using the resource.
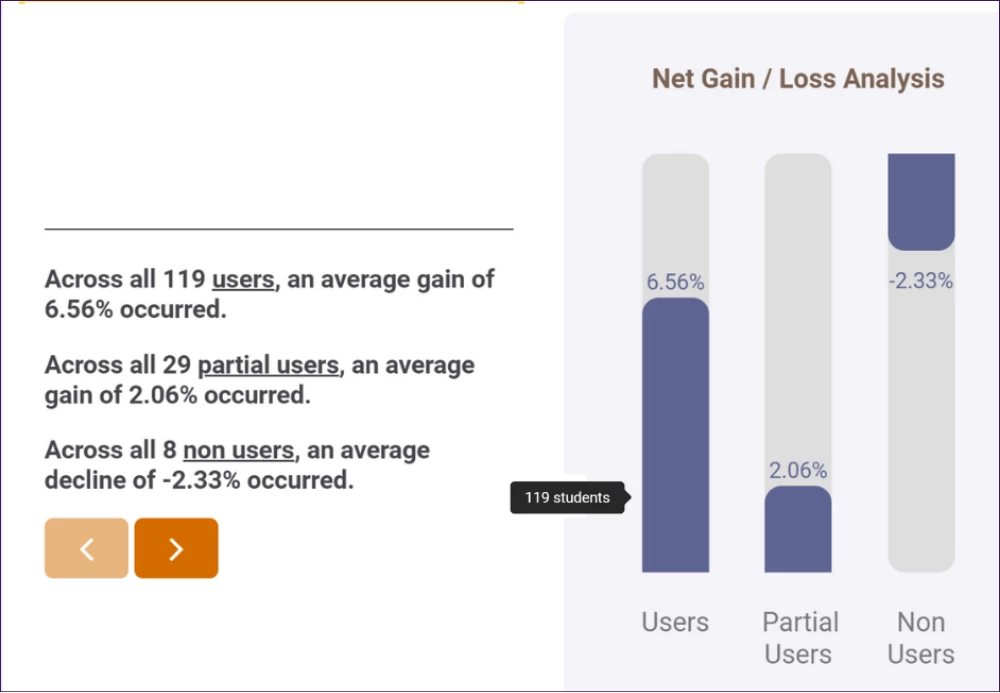
Net Gain / Loss Analysis: This chart shows you the % increase or decline of your users and non-users. It is useful to determine whether or not there is a material added benefit from using the resource.