

Report Summary: Cohort Trends
The Cohort Trends Report tracks how students perform over time, using any assessment organized by proficiency levels. This report gives districts a clear, level-by-level view of student progress across years, helping identify learning gains, stalled growth, or performance gaps. With optional Dual Point Analysis, users can compare performance across two years to measure growth and evaluate instructional impact.
Who Uses This Report?
- School Administrators: Monitor achievement distribution and growth by school to inform strategic planning.
- District Administrators: Identify long-term cohort trends and track how instructional programs are driving improvement or learning loss.
- Curriculum Coordinators: Evaluate curriculum effectiveness and adjust based on performance movement across grade levels.
- Teachers: Understand how their current students progressed in prior years or how former students performed after leaving their classrooms.
- Data Analysts: Analyze year-over-year performance across subgroups and measure return on instructional investment.
Key Questions Answered
How did a specific cohort of students perform across multiple years?
- Track student achievement over time to see how performance shifts as a group progresses through grade levels.
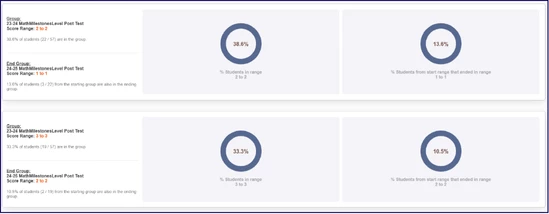
How many students moved up (or down) in proficiency over time?
- View changes in achievement levels (e.g., from Developing to Proficient) to assess growth or identify stalled progress.
Are instructional strategies sustaining student growth from year to year?
- Evaluate whether gains in one grade level carry forward into the next, helping assess long-term impact.
Where are learning gaps or stalled progress emerging by school or subgroup?
- Pinpoint where students may need additional support by analyzing trends across campuses or student populations.
What percent of students fall into Beginning, Developing, Proficient, or Distinguished levels?
- Get a clear view of achievement distribution to support MTSS planning, curriculum adjustments, and targeted interventions.
How to Access and Use the Report
- Log in to the ROI Dashboard: Ensure you have the necessary credentials to access the platform.
- Select Cohort Trends Report: Locate and select the report from the available menu options.
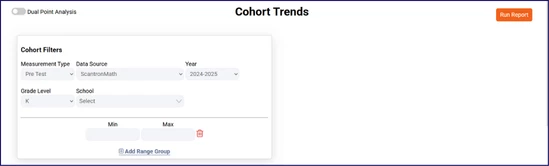
- Input Cohort Filters:
- Measurement Type: Choose the type of assessment (e.g., Pre Test, Post Test).
- Data Source: Select the specific assessment vendor (e.g., ScantronMath).
- Year: Pick the school year of interest.
- Grade Level: Choose the student cohort’s current or starting grade level.
- School: Choose one or multiple schools to include in the report.
- Score Range (Optional): Use Min and Max fields to define a score band for analysis.
- Add Range Group (Optional): Create multiple scoring bands for detailed segmentation.
- Enable Dual Point Analysis (Optional): Use the toggle at the top of the report to compare two types of measurement data (e.g., Pre vs. Post Test) across time.
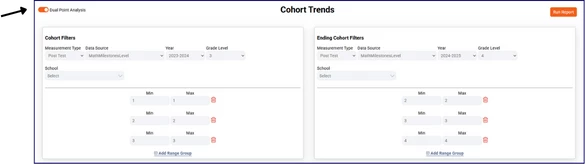
- Run the Report: Click Run Report to view the longitudinal trend data.