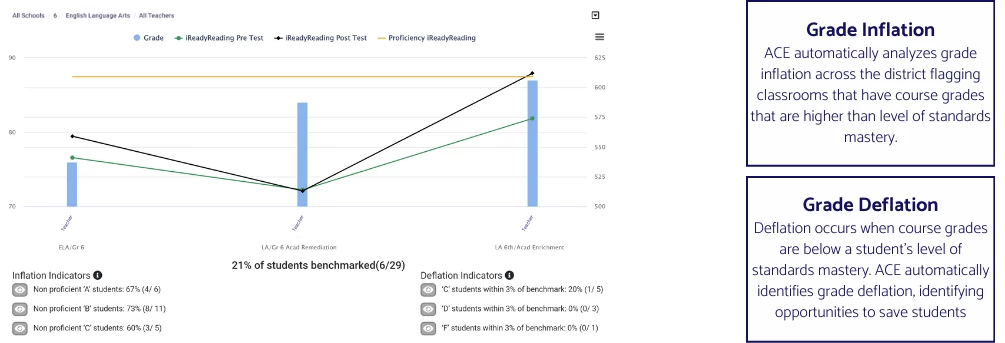
The ACE Report correlates student grades with benchmark assessments to identify grade inflation or deflation. It helps users spot performance trends, subgroup gaps, and alignment across grades, campuses, and teachers for improved decision-making.
Who Uses This report?
School Administrators: Identify grade inflation or deflation by correlating student grades with benchmark mastery.
District Administrators: Compare performance at the district level and spot trends across various schools.
Curriculum Coordinators: Evaluate the relationship between course grades and assessments to adjust curriculum strategies.
Teachers: Analyze student performance to tailor instruction based on grade correlation with benchmark mastery.
Assessment Coordinators: Ensure benchmarks are aligned with course grades to maintain academic standards.
Data Analysts: Use data correlations to inform decisions regarding academic grading and student performance.
Key Questions Answered
Are student grades reflective of their mastery of the benchmark assessments?
The report correlates course grades with benchmark assessments to detect discrepancies like grade inflation or deflation.
How do different subgroups perform on assessments relative to their grades?
Filter by subgroup to identify performance gaps within student groups.
Which teachers or campuses show significant alignment or misalignment?
Break down data by teacher or campus to see alignment between course grades and benchmark assessments.
Which grade levels show the strongest or weakest alignment?
Identify the grade levels where student performance in course grades is most or least aligned with benchmarks.
How to Access the ACE Report
Video Tutorial: Click HERE for a walkthrough on creating and interpreting the report.
Log in to the ROI Dashboard: Ensure you have the necessary credentials to access the platform.
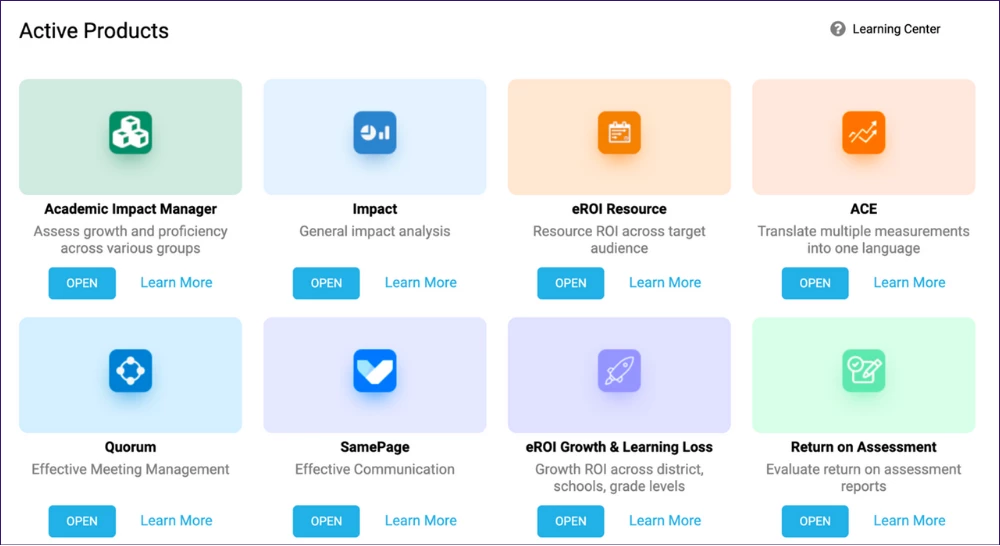
Select the ACE Report: Navigate through the available reports and select "ACE (Assessment Correlation Engine) Report."
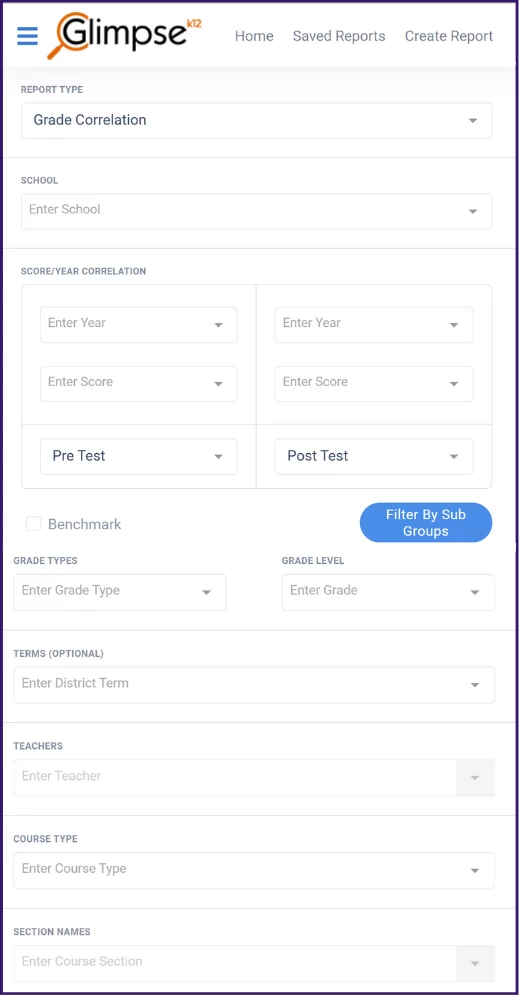
Input Data Criteria:
Select Campus: Choose either "Select All" or specific campus names as needed.
Select Year of Assessment: Specify the year of the assessment to be analyzed.
Select Assessment: Choose the assessment you wish to correlate with the course grade.
Select Range of the Assessment: Define the range or scope of the assessment.
Choose the Grading Period: Enter the grading period you want to focus on.
Select Teacher: If "All Teachers" is selected, only the teachers corresponding to the selected grade level will be included in the report.
Select Classes (Courses): Course section names are populated from the Student Information System.
Run the Report: Click "Run Report" to generate your correlation analysis.
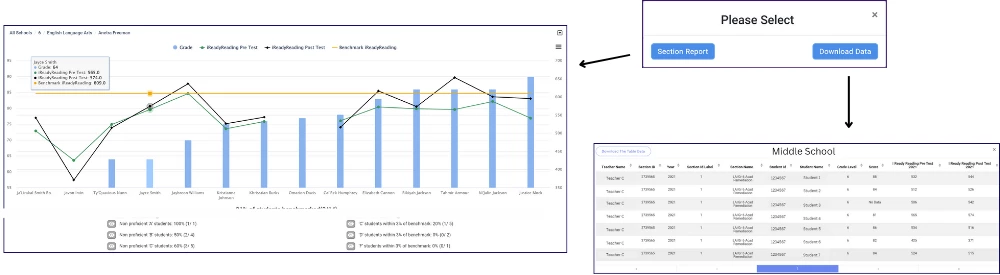
View Data: View each classroom report in an itemized list or student chart format. Click on the blue bar for a class to open the Section Report for more detailed data.