
The eROI Proficiency Report helps educators identify how students are performing in relation to a defined proficiency threshold on key assessments. It provides district, school, grade-level, and subgroup breakdowns of proficiency rates, highlighting students who are proficient, nearly proficient, and those who are below proficiency. This report enables data-driven instructional planning, targeted intervention, and strategic resource allocation.
Who Uses This Report?
- School Administrators: Understand proficiency distribution across schools to inform leadership decisions and resource allocation.
- District Administrators: Compare proficiency outcomes district-wide to evaluate instructional effectiveness and support strategies.
- Curriculum Coordinators: Identify subjects or grades with low proficiency to guide curriculum adjustments.
- Teachers: Identify students below proficiency thresholds to tailor interventions and differentiated instruction.
- Assessment Coordinators: Ensure assessments are effectively measuring student proficiency.
- Data Analysts: Monitor proficiency trends and inform policy or strategy changes with evidence-based insights.
Key Questions Answered
Which students are above or below the proficiency line on an assessment?
- Segment students by performance to identify those who need support or enrichment.
What is the overall proficiency rate across the district, schools, and grade levels?
- Gain a high-level view of where students are meeting standards—and where gaps exist.
How does proficiency differ across schools or grades?
- Use comparisons to drive targeted improvement strategies.
Are instructional approaches driving student proficiency?
- Inform decisions about which strategies or supports yield the highest ROI in student learning.
Where should we focus intervention resources?
- Identify underperforming subgroups or grades and adjust planning accordingly.
How to Access and Use the Report
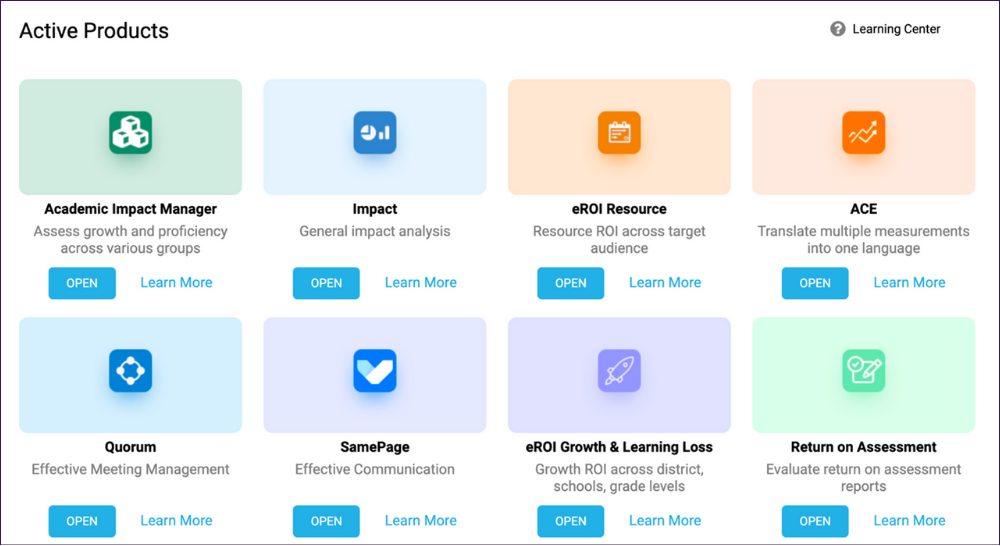
- Log in to the ROI Dashboard: Ensure you have the necessary credentials to access the platform.
- Select eROI Proficiency Report: From the available reports, choose the eROI Proficiency option.
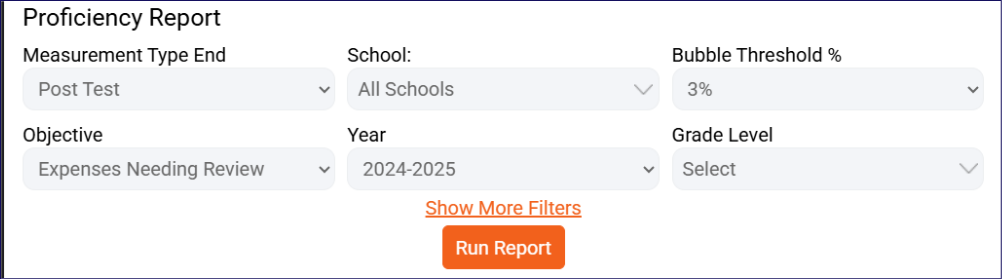
- Choose Report Settings:
- Select Measurement Type: Choose the assessment timing.
- Select Objective: Select the specific learning objective.
- Select Year: Choose the school year for the data.
- Select School & Grade Level: Select district-wide, specific schools, and/or grades.
- Select Bubble Threshold %: Choose the performance band close to the proficiency cut line.
- Set Additional Filters (Optional): Click Show More Filters to segment data by:
- Ethnicity
- Special Ed
- ELL (English Language Learners)
- Lunch Status
- Custom Subgroup
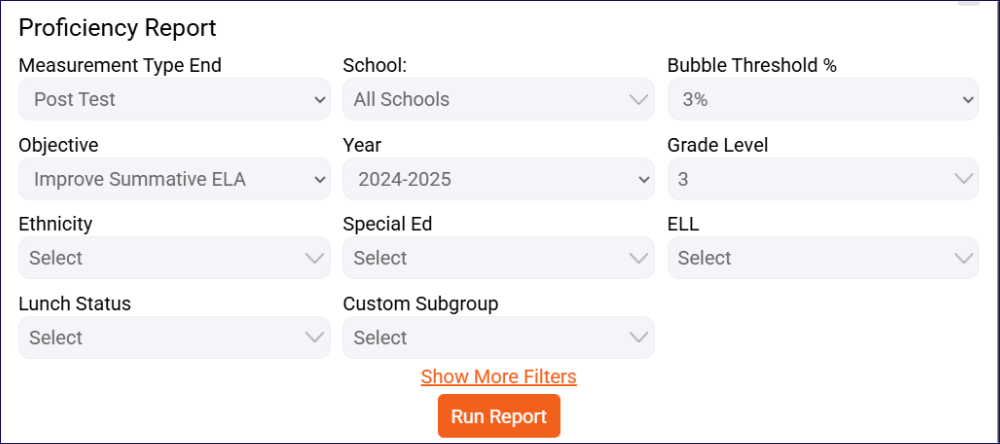
- Run the Report: Click the Run Report button to generate your results.
-
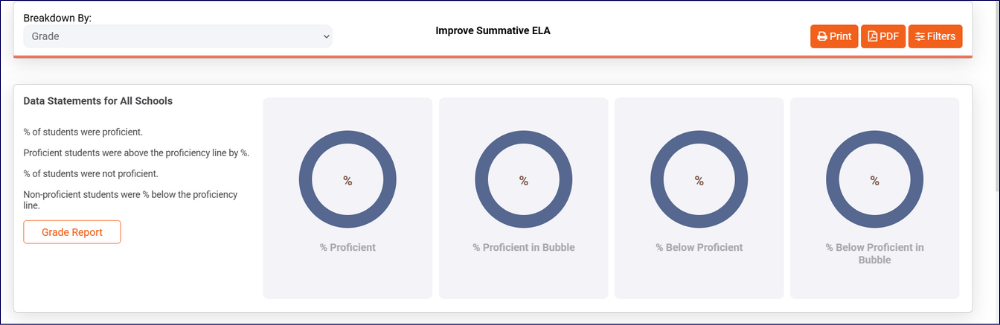
Analyze Results: View student performance visualized as ring charts displaying the percentage of students who are Proficient, Proficient in the Bubble, Below Proficient, and Below Proficient in the Bubble.
-
Read Data Statements: Summary statements provide key takeaways based on the filtered results.
-
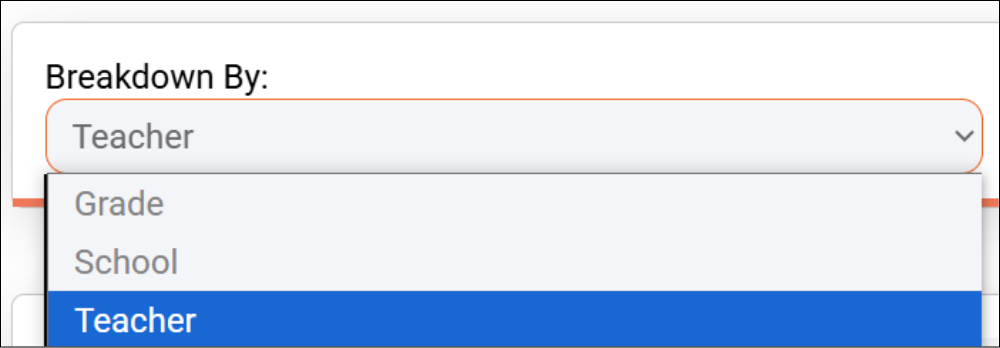
- Break Down Data by Group: Use the “Breakdown By” dropdown to toggle between views by Grade, School, or Teacher to identify trends and performance gaps across levels.
- View Detailed Reports: Click Grade Report, School Report, or Teacher Report to open a detailed breakdown showing individual grade-level or school-level performance.